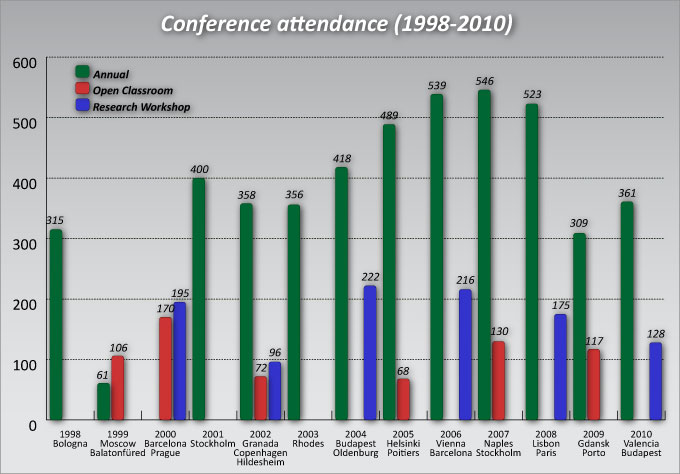
The following graphs present the development of institutional and individual members during the past 20 years, further the impressive figures of conference participants attending the annual and thematic conferences of EDEN.
Chart 1 Institunional Membership
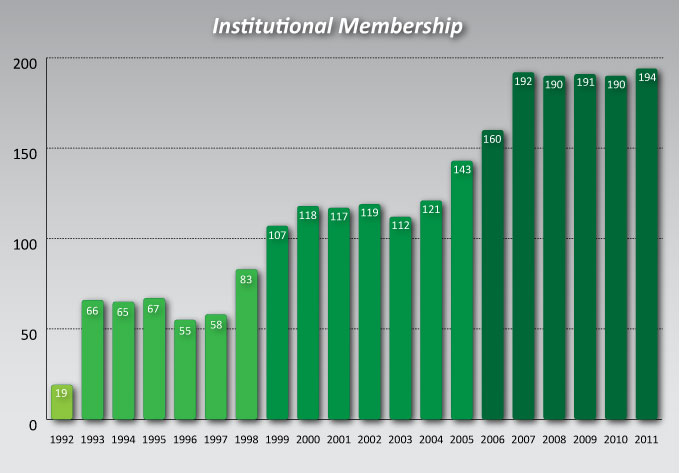
Chart 2 Institutions Represented
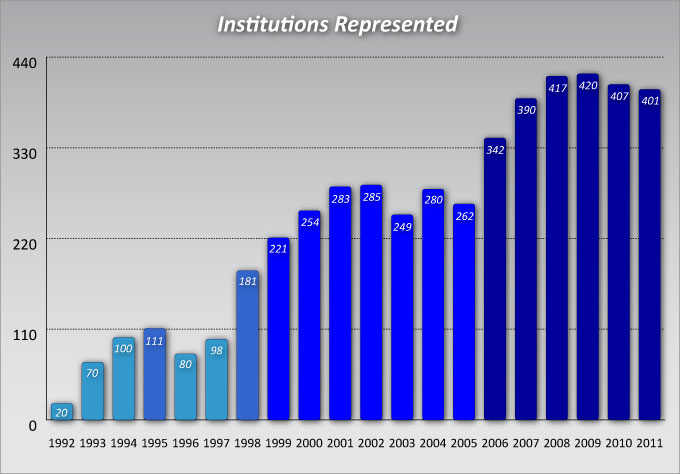
Chart 3 NAP Members
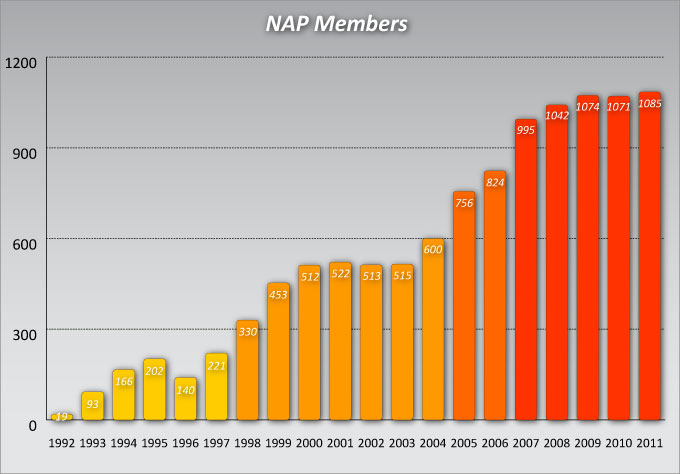
Chart 4 Conference attendance (1998-2010)